4 areas/22 issues the JAL Group will be working on
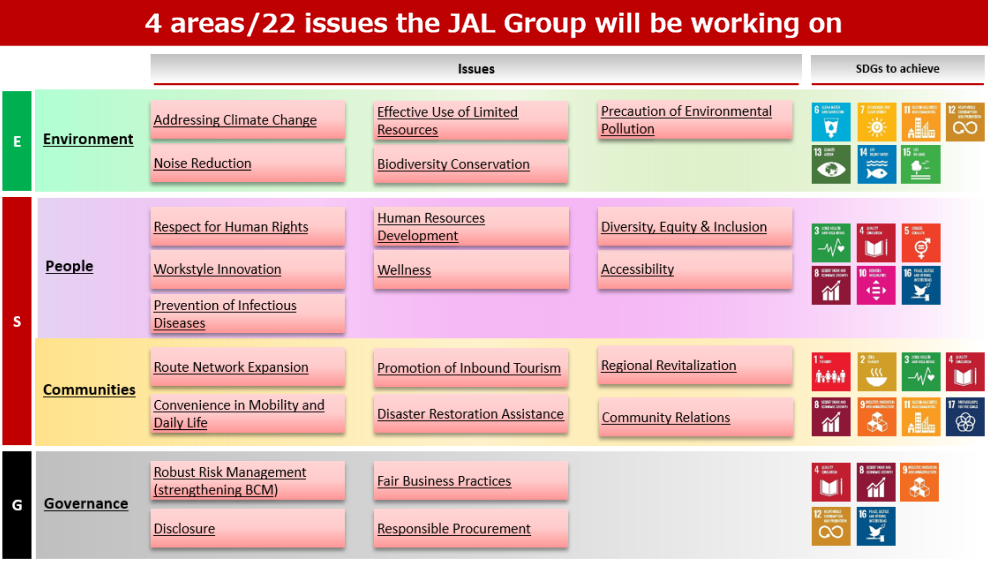
We have stated the four key areas "Environment", "People", "Communities" and "Governance", and classified them into 22 issues to work on per area.
Key initiatives towards sustainability
The JAL Group has set mid-term goals in each of the "four areas/22 issues" that we are working on, and will promote ESG management to achieve the SDGs, aiming to realize a sustainable society through business activities.
E (Environment)
Reduction of CO2 emissions
This table can be scrolled horizontally.
| Performance indicators |
Results of FY19 |
Results of FY20 |
Results of FY21 |
Results of FY22 |
Target for FY25 |
Contribution to SDGs |
| CO2 emission Scope 1 [aviation] |
9.09 million tons |
4.39 million tons |
6.18 million tons |
8.19 million tons |
Below 9.09 million tons |
|
| CO2 emission per revenue ton kilometer (RTK) |
1.0648kg-CO2/ton kilo |
1.3763kg-CO2/ton kilo |
1.2751kg-CO2/ton kilo |
1.0829kg-CO2/ton kilo |
0.8187kg-CO2/ton kilo |
| CO2 emission Scope 2 [ground facilities] |
57,000 tons |
51,000 tons |
53,000 tons |
56,000 tons |
54,000 tons |
| Ratio of fuel-efficient aircraft |
82% |
84% |
85% |
86% |
86% |
| Ratio of SAF loaded in total fuel amount |
0.0001%
Loaded to all 5 delivered A350 aircrafts |
0.0000009%
Loaded domestically produced SAF in Japan domestic regular flights |
0.0002%
・Loaded to 4 A350 delivery flights
・Loaded 2 different types of SAF to Japan domestic regular flights |
0.004% |
Replace 1% of total fuels to SAF |
| Amount of reduction by JAL Green Operations (reducing CO2 emissions in daily operations) |
157,000 tons
(1.7% of total emission) |
82,000 tons
(1.8% of total emission) |
142,000 tons
(2.3% of total emission) |
195,000 tons (2.4% of total emissions) |
Reduce 2.5% amount of CO2 emitted from aircraft |
|
| Number of JAL Carbon Offset visitors |
*Tracked from FY21 Q4 |
13,122 people (1.5 times v.s. FY21) |
30,000 people (3.4 times v.s. FY21) |
|
This table can be scrolled horizontally.
Plastic use reduction
This table can be scrolled horizontally.
| Performance indicators |
Results of FY19 |
Results of FY20 |
Results of FY21 |
Results of FY22 |
Target for FY25 |
Contribution to SDGs |
| Reduction ratio of new petroleum derived single plastic use items in in-house standard products used in-flight and in lounges |
2.5% |
10.4% |
25.0% |
45.0% |
100.0% |
|
| Ratio of eco-friendly material in plastic bags used in airports and cargo transport |
*started from FY20 |
87.6% |
90.0% |
91.0% |
100.0% |
This table can be scrolled horizontally.
In-flight meals disposal reduction
This table can be scrolled horizontally.
| Performance indicators |
Results of FY19 |
Results of FY20 |
Results of FY21 |
Results of FY22 |
Target for FY25 |
Contribution to SDGs |
| Number of routes with meal pre-cancellation service introduced |
*started from FY20 |
7 routes
(18% of 39 routes) |
19 routes
(48% of 39 routes) |
All routes |
All routes |
|
| Recycling ratio of cooking residue in preparing inflight meals |
7.7% |
28.0% |
34.0% |
100% |
100% |
This table can be scrolled horizontally.
Paper reduction
This table can be scrolled horizontally.
| Performance indicators |
Results of FY19 |
Results of FY20 |
Results of FY21 |
Results of FY22 |
Target for FY25 |
Contribution to SDGs |
| Paperless in cargo sheds |
- |
- |
- |
- |
Complete paperless in JAL flights |
|
This table can be scrolled horizontally.
Industrial waste reduction
This table can be scrolled horizontally.
| Performance indicators |
Results of FY19 |
Results of FY20 |
Results of FY21 |
Results of FY22 |
Target for FY25 |
Contribution to SDGs |
| Final disposal rate |
0.3% |
0.6% |
0.3% |
0.6% |
Keep below 1% |
|
This table can be scrolled horizontally.
Operation with low-noise aircrafts
This table can be scrolled horizontally.
| Performance indicators |
Results of FY19 |
Results of FY20 |
Results of FY21 |
Results of FY22 |
Target for FY25 |
Contribution to SDGs |
| Ratio of ICAO Chapter 4 standard compliant aircraft |
100% |
100% |
100% |
100% |
100% |
|
This table can be scrolled horizontally.
Prevention of illegal wildlife trade
This table can be scrolled horizontally.
| Performance indicators |
Results of FY19 |
Results of FY20 |
Results of FY21 |
Results of FY22 |
Target for FY25 |
Contribution to SDGs |
| Number of violations (number of illegal wildlife transported/violations against ESG risk foodstuff and commodity guidelines |
ー |
ー |
ー |
0 times |
0 times |
|
This table can be scrolled horizontally.
Use of certified products
This table can be scrolled horizontally.
| Performance indicators |
Results of FY19 |
Results of FY20 |
Results of FY21 |
Results of FY22 |
Target for FY25 |
Contribution to SDGs |
| Ratio of paper items with international certification in consideration with forest resources |
24.2% |
66.5% |
66.5% |
87.8% |
100% |
|
This table can be scrolled horizontally.
S (People)
Promotion of boarding passengers who feel barriers to travelling
This table can be scrolled horizontally.
| Performance indicators |
Results of FY19 |
Results of FY20 |
Results of FY21 |
Results of FY22 |
Target for FY25 |
Contribution to SDGs |
| Ratio of such passengers onboard |
0.36% |
0.29%
(0.8 times v.s. FY19) |
0.64%
(1.8 times v.s. FY19) |
0.71%
(1.9 times v.s. FY19) |
2.5 times v.s. FY19 |
|
| Number of wooden chairs which do not get caught in metal detectors |
478 wheelchairs |
478 wheelchairs |
478 wheelchairs |
508 wheelchairs |
580 wheelchairs |
This table can be scrolled horizontally.
Improvement of working productivity
This table can be scrolled horizontally.
| Performance indicators |
Results of FY19 |
Results of FY20 |
Results of FY21 |
Results of FY22 |
Target for FY25 |
Contribution to SDGs |
| Total work hours |
1,862 hours/person |
1,878 hours/person |
1,890 hours/person |
1,884 hours/person |
1,850 hours/person |
|
| Ratio of annual paid leave taken |
79.0% |
71.5% |
74.5% |
81.0% |
100% |
| Monthly overtime/working hours on holidays per employee |
9.5 hours/person |
8.0 hours/person |
9.9 hours/person |
10.5 hours/person |
4 hours/person
(linked with the annual total work hour target of 1,850 hours) |
This table can be scrolled horizontally.
Promotion of diverse workstyles
This table can be scrolled horizontally.
| Performance indicators |
Results of FY19 |
Results of FY20 |
Results of FY21 |
Results of FY22 |
Target for FY25 |
Contribution to SDGs |
| Cumulative total number of people who used telework |
36,105 people |
336,287 people |
346,167 people |
277,028 people |
Track record |
|
| Number of workcation/bleisure system used |
247 times
(workcation only) |
918 times |
1,533 times |
1,521 times |
Track record |
This table can be scrolled horizontally.
Promotion of diverse talent participating actively in work
This table can be scrolled horizontally.
| Performance indicators |
Results of FY19 |
Results of FY20 |
Results of FY21 |
Results of FY22 |
Target for FY25 |
Contribution to SDGs |
| Ratio of disabled staff hiring*1 |
2.62% |
2.67% |
2.64% |
2.75% |
3.2% |
|
| Ratio of female managers*2 |
18.4% |
19.5% |
21.9% |
22.8% |
30.0% |
| Number of people who used childcare leave system |
743 people |
946 people |
934 people |
1,089 people |
Track record |
|
| Number of people who used nursing care leave system |
53 people |
40 people |
20 people |
42 people |
Track record |
This table can be scrolled horizontally.
- *1:Combined data for Japan Airlines Co., Ltd. and its special subsidiary JAL Sunlight Co., Ltd.
- *2:Data of the JAL Group
Conducting of Human Rights Due Diligence
This table can be scrolled horizontally.
| Performance indicators |
Results of FY19 |
Results of FY20 |
Results of FY21 |
Results of FY22 |
Target for FY25 |
Contribution to SDGs |
| Ratio of actions taken towards Human Rights Due Diligence |
*Tracked from FY22 |
100% |
100% |
|
This table can be scrolled horizontally.
Enhancement of employee training
This table can be scrolled horizontally.
| Performance indicators |
Results of FY19 |
Results of FY20 |
Results of FY21 |
Results of FY22 |
Target for FY25 |
Contribution to SDGs |
| Training hours per person |
72.3 hours/person |
277.1 hours/person |
162.3 hours/person |
259.4 hours/person |
Track record |
|
| Training cost per person |
¥449,480 /person |
¥109,321 /person |
¥84,469 /person |
¥138,651 /person |
Track record |
This table can be scrolled horizontally.
Improvement of employee satisfaction
This table can be scrolled horizontally.
| Performance indicators |
Results of FY19 |
Results of FY20 |
Results of FY21 |
Results of FY22 |
Target for FY25 |
Contribution to SDGs |
| Ratio of actively engaged employees |
54.4% |
54.4% (no survey) |
51.7% |
51.7% (no survey) |
64.4% |
|
This table can be scrolled horizontally.
Improvement of health check-up ratio
This table can be scrolled horizontally.
| Performance indicators |
Results of FY19 |
Results of FY20 |
Results of FY21 |
Results of FY22 |
Target for FY25 |
Contribution to SDGs |
| Ratio of check-ups taken by employee |
100% |
100% |
100% |
100% |
Keep 100% |
|
| Ratio of check-ups taken by family members |
37.5% |
36.0% |
40.7% |
47.1% |
75% |
This table can be scrolled horizontally.
Ratio improvement of gynecological check-ups
This table can be scrolled horizontally.
| Performance indicators |
Results of FY19 |
Results of FY20 |
Results of FY21 |
Results of FY22 |
Target for FY25 |
Contribution to SDGs |
| Ratio of breast cancer check-up taken (including family members) |
36.7% |
43.4% |
64.6% |
65.5% |
70% |
|
| Ratio of uterine cancer check-up taken (including family members) |
30.7% |
38.6% |
58.4% |
60.5% |
60% |
This table can be scrolled horizontally.
Activation of medical items transportation
This table can be scrolled horizontally.
| Performance indicators |
Results of FY19 |
Results of FY20 |
Results of FY21 |
Results of FY22 |
Target for FY25 |
Contribution to SDGs |
| Weight of transported medical items |
610 tons |
721 tons
(+18% v.s. FY19 result) |
1,172 tons
(+92% v.s. FY19 result) |
1,363 tons
(+123% v.s. FY19 result) |
+50% v.s. FY19 result |
|
This table can be scrolled horizontally.
S (Communities)
Promotion of passengers from outside of Japan boarding on Japan domestic flights
This table can be scrolled horizontally.
| Performance indicators |
Results of FY19 |
Results of FY20 |
Results of FY21 |
Results of FY22 |
Target for FY25 |
Contribution to SDGs |
| Number of people boarded |
701,240 people |
49,188 people |
121,844 people |
582,180 people |
1,505,000 people |
|
This table can be scrolled horizontally.
Expansion of service due to more contracts
This table can be scrolled horizontally.
| Performance indicators |
Results of FY19 |
Results of FY20 |
Results of FY21 |
Results of FY22 |
Target for FY25 |
Contribution to SDGs |
| Number of contracted flights from overseas airlines for passenger/cargo |
87,000 flights |
9,000 flights |
17,000 flights |
29,000 flights |
128,000 flights |
|
This table can be scrolled horizontally.
Increase of tourists and cargo to regional areas
This table can be scrolled horizontally.
| Performance indicators |
Results of FY19 |
Results of FY20 |
Results of FY21 |
Results of FY22 |
Target for FY25 |
Contribution to SDGs |
| Ratio of increase (passenger) |
- |
-74.2% v.s. FY19 result
*excluding LCC |
-59% v.s. FY19 result
*excluding LCC |
-15% v.s. FY19 result |
+10% v.s. FY19 result |
|
| Ratio of increase (cargo) |
- |
-30% v.s. FY19 results |
-34% v.s. FY19 results |
-17% v.s. FY19 results |
+10% v.s. FY19 result |
This table can be scrolled horizontally.
Expansion of related population by arranging ways to go to regional areas
This table can be scrolled horizontally.
| Performance indicators |
Results of FY19 |
Results of FY20 |
Results of FY21 |
Results of FY22 |
Target for FY25 |
Contribution to SDGs |
| Measures to preserve the environment of regions and inviting people to regions |
- |
- |
- |
12 measures |
25 measures |
|
This table can be scrolled horizontally.
Disaster relief
This table can be scrolled horizontally.
| Performance indicators |
Results of FY19 |
Results of FY20 |
Results of FY21 |
Results of FY22 |
Target for FY25 |
Contribution to SDGs |
| Amount of money donated by Charity Miles |
¥9,208,500 |
¥11,328,500 |
¥0 |
¥4,611,500 |
Track record |
|
This table can be scrolled horizontally.
Preserving and development of regional routes including island routes
This table can be scrolled horizontally.
| Performance indicators |
Results of FY19 |
Results of FY20 |
Results of FY21 |
Results of FY22 |
Target for FY25 |
Contribution to SDGs |
Number of Domestic sites
(including code share)
|
62 sites |
61 sites |
61 sites |
64 sites |
65 sites |
|
This table can be scrolled horizontally.
Commercialization of drone logistics/”flying cars” air taxi
This table can be scrolled horizontally.
| Performance indicators |
Results of FY19 |
Results of FY20 |
Results of FY21 |
Results of FY22 |
Target for FY25 |
Contribution to SDGs |
| Realization of commercialization |
- |
- |
- |
- |
FY23: commercialization of drone logistics
FY25: commercialization of air taxi |
|
This table can be scrolled horizontally.
Promotion of volunteerism
This table can be scrolled horizontally.
| Performance indicators |
Results of FY19 |
Results of FY20 |
Results of FY21 |
Results of FY22 |
Target for FY25 |
Contribution to SDGs |
| Number of people joined |
7,745 people |
9,772 people |
6,125 people |
5,198 people |
Track record |
|
| Total hours |
51,734 hours |
33,600 hours |
27,952 hours |
21,361 hours |
Track record |
This table can be scrolled horizontally.
“Support children’s dreams” project
This table can be scrolled horizontally.
| Performance indicators |
Results of FY19 |
Results of FY20 |
Results of FY21 |
Results of FY22 |
Target for FY25 |
Contribution to SDGs |
| Miles donated |
*started from FY22 |
3,843,000 miles |
3,000,000 miles |
|
This table can be scrolled horizontally.
Nurturing the next generation
This table can be scrolled horizontally.
| Performance indicators |
Results of FY19 |
Results of FY20 |
Results of FY21 |
Results of FY22 |
Target for FY25 |
Contribution to SDGs |
| Number of people who joined the SORAIKU®*3 |
191,840 people |
20,435 people |
50,147 people |
52,586 people |
Track record |
|
This table can be scrolled horizontally.
- *3: Activities in order to think about their own futures, future of Japan, the World and the Earth by experiencing the wonder of the skies
G (Governance)
Compliance to the Corporate Governance Code
This table can be scrolled horizontally.
| Performance indicators |
Results of FY19 |
Results of FY20 |
Results of FY21 |
Results of FY22 |
Target for FY25 |
Contribution to SDGs |
| Compliance rate |
100% |
100% |
100% |
100% |
Keep 100% |
|
This table can be scrolled horizontally.
Function improvement of Board of Directors
This table can be scrolled horizontally.
| Performance indicators |
Results of FY19 |
Results of FY20 |
Results of FY21 |
Results of FY22 |
Target for FY25 |
Contribution to SDGs |
| Ratio of External Directors |
30% |
30% |
One third |
One third |
Over one third |
|
| Attendance ratio of External Directors and Auditors to Board of Directors |
98.3% |
100% |
100% |
99.6% |
Keep over 80% |
This table can be scrolled horizontally.
Prevention of information leakage
This table can be scrolled horizontally.
| Performance indicators |
Results of FY19 |
Results of FY20 |
Results of FY21 |
Results of FY22 |
Target for FY25 |
Contribution to SDGs |
| Number of incidents occurred |
0 cases |
2 cases*4 |
0 cases |
2 cases |
0 cases |
|
This table can be scrolled horizontally.
- *4: Number of incidents reported to authorities as information leakage
Prevention of corruption and bribery
This table can be scrolled horizontally.
| Performance indicators |
Results of FY19 |
Results of FY20 |
Results of FY21 |
Results of FY22 |
Target for FY25 |
Contribution to SDGs |
| Number of corruption and bribery |
0 cases |
0 cases |
0 cases |
0 cases |
0 cases |
|
This table can be scrolled horizontally.
Supply chain management
This table can be scrolled horizontally.
| Performance indicators |
Results of FY19 |
Results of FY20 |
Results of FY21 |
Results of FY22 |
Target for FY25 |
Contribution to SDGs |
| Soundness confirmation ratio of primary suppliers |
18% |
37% |
62% |
81% |
100% |
|
| Number of regulatory safety audits of all caterer factories and in-flight supply storerooms per year |
2 times |
2 times |
2 times |
2 times |
2 times |
This table can be scrolled horizontally.
Improvement of BCP effectiveness
This table can be scrolled horizontally.
| Performance indicators |
Results of FY19 |
Results of FY20 |
Results of FY21 |
Results of FY22 |
Target for FY25 |
Contribution to SDGs |
| Number of exercises conducted per BCM |
1 time |
1 time |
4 times |
4 times |
2 times |
|
This table can be scrolled horizontally.
Reinforcement of information disclosure in Sustainability pages of the Corporate website
This table can be scrolled horizontally.
| Performance indicators |
Results of FY19 |
Results of FY20 |
Results of FY21 |
Target for FY22 |
Target for FY25 |
Contribution to SDGs |
| Number of views |
765,912 |
786,229 |
893,469 |
840,170 |
Over 1,000,000 |
|
This table can be scrolled horizontally.
